Using the HeatTile approach for a progressive data streaming and visualization technique.
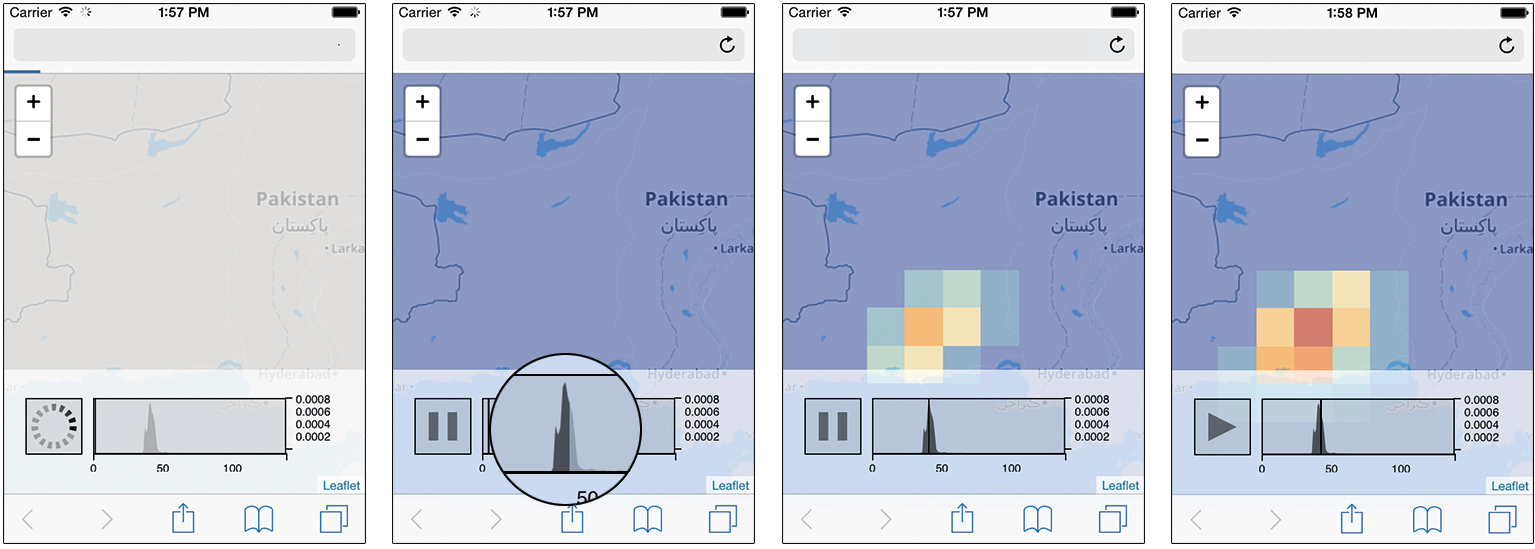
At the heart of the approach lies the usage of the EventSource Interface. That streams the data from the server in one chunk per point in time. In the example you will find additional variables to modify the visualization and the aggregation:
var vis = "hex" || "square"
var vis_type = "value_max" || "value_min" || "value_avg"
http://prjcts.sebastianmeier.eu/stream/demos/continous/examples/playbar.html
http://prjcts.sebastianmeier.eu/stream/demos/continous/examples/new.html
We use the same data structure than in the HeatTile approach, but we extend it by two variables: time and intensity. The time attribute will be used to create the time based animation of the heatmap visualization. And the intensity will be used for applying the color to a certain area. As we are using a clustering algorithm to create the various zoom levels we have to summarize the clustered levels of intensity. Depending on what you want to communicate you need to apply different clustering functions, as we are interested in peaks, rather than the average distribution, we use a MAX function (other function include SUM, AVG, MIN, etc. (These are standard SQL summary functions.)).
parse.php presents a sample parsing script for entering data files into a mysql table, upon which we perform the HeatTile tiling algorithm.
After completing the HeatTile tiling algorithm we can run a test SQL query to illustrate the above mentioned summary functions:
'SELECT
	`time`,
	COUNT(`countmax`) AS `count`,
	MAX(`countmax`) AS `max`,
	MIN(`countmax`) AS `min`,
	AVG(`countmax`) AS `avg`,
	SUM(`sum_intensity`) AS `value_sum`,
	MIN(`min_intensity`) AS `value_min`,
	MAX(`max_intensity`) AS `value_max`,
	AVG(`avg_intensity`) AS `value_avg`
FROM
	(SELECT
		COUNT(*) AS `countmax`,
		`time`,
		SUM(`intensity`) AS `sum_intensity`,
		MIN(`intensity`) AS `min_intensity`,
		MAX(`intensity`) AS `max_intensity`,
		AVG(`intensity`) AS `avg_intensity`
	FROM
		`'.$db_table.'`
	WHERE
		`validconversion` = 1
	GROUP BY
		`time`,
		`z5`
	)
AS
	`count_max`
GROUP BY
	`time`
ORDER BY
	`time` DESC'
In the above code we group the tiles on zoom level 5 (column z5) and by time, to get a summary for each point in time.