-- Measuring the flow of your application --
Plumber is a profiling and tracing GUI with the following features:
- list all profiling runs in an overview
- show a graphical timeline for a single profiling run
- filter the graphical timeline
- show the xhprof analyzer for a single profiling run
- compare two profiling runs with the timeline
- tag your profiling runs
- show aggregated statistics in the overview
It relies on PhpProfiler for gathering the needed information.
Warning: Do not install Plumber on production websites. If you do, make sure to disallow access to the profiler URLs.
To install, just use composer:
composer require --dev sandstorm/plumber 3.0.*The system will automatically install PhpProfiler and use XHProf if it is installed.
XHProf is not supported anymore, but the Tideways data format is still 100% compatible - and the Tideways PHP Extension is still 100% open source
# for PHP 8.1
brew install kabel/pecl/php@8.1-tideways-xhprof


# for older versions
brew install  tideways/homebrew-profiler/php71-tideways --env=std
echo "tideways.auto_prepend_library=0" >> /usr/local/etc/php/7.1/conf.d/ext-tideways.iniSome settings are available in Plumber and PhpProfiler as well as the TYPO3 CMS extension, none of which are needed for basic operation. Feel free to investigate them if you feel like it.
Just use your web application as normal. To browse profiling reports, go to http://yourhost/profiler/.
For each run, the profiler collects the following data:
- meta-information for the current run (like: the context the request was invoked in, the controller being used)
- timers which can be started and stopped, measuring the details of the application flow.
- the full XHProf profile, containing the (almost) complete call-graph of the run. This is only enabled if XHProf is installed.
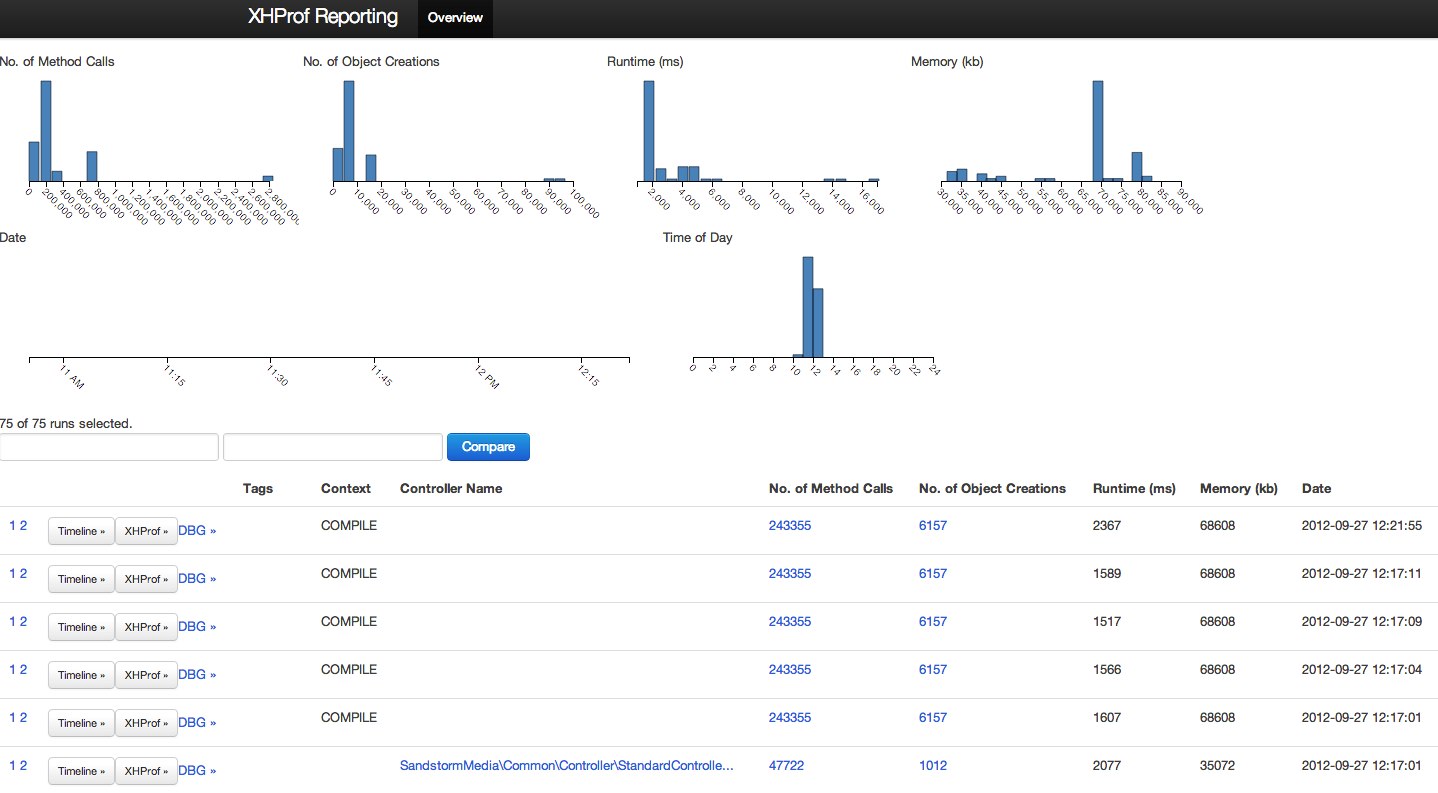
The overview page is the main entry point to the profiler. It shows the different profiling runs. For each profiling run, it can display overview information like the number of created objects or the memory consumption. Each of the columns of the table is called a dimension.
On top, the bar charts show how the values in a given dimension are distributed, and allow you to filter the different dimensions to the wanted values.
You can easily create your own dimensions; how to do that is explained later.
The timeline page gives a visual overview of a request, showing the timers of the request, and how memory consumption changed.
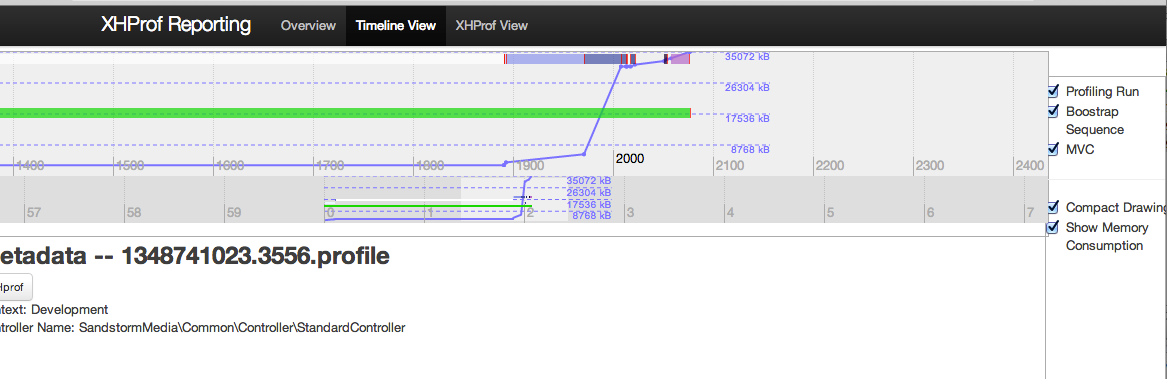
You can also drill down to the XHProf page, showing the detailed statistics of the run.
The available dimensions are configured inside the Settings.yaml and that's
also how you can add new dimensions.
Let's check how the default dimensions work:
Sandstorm:
  Plumber:
    calculations:
      methodCallsOnObject:
        label: 'No. of Method Calls'
        type: regexSum
        regex: '#==>(.*)::.*#'
      totalRuntime:
        label: 'Runtime (ms)'
        type: timerSum
        timerName: 'Profiling Run'
      totalMemory:
        label: 'Memory (kb)'
        type: maxMemory
It defines three dimensions, and gives each of them a label. Each dimension has
a type which specifies how the data inside this dimension is aggregated.
We support the following types:
Parameters: None
Output the maximum memory which has been used in kilobytes.
Parameters: timerName
This one sums up the total runtime in milliseconds of a timer specified by timerName.
Parameters: regex
This is the most versatile counter. It needs XHProf to be installed, else it does not work.
It counts the number of method invocations in an XHProf trace. To know how the regex
parameter works, we need to check how an XHProf trace is built:
An XHProf trace is a big array with elements like the following:
	'Sandstorm\PhpProfiler\Domain\Model\ProfilingRun::startTimer==>microtime' (76) => array(2)
	   'ct' (2) => integer 10
	   'wt' (2) => integer 9
This means: "From inside the method startTime in ProfilingRun the function microtime has
been called 10 times. All these calls to microtime together needed 9 milliseconds."
I'm currently not sure about the time scale, whether it's micro- or milliseconds...
Now, the regexSum loops over such a trace, and if the regex matches the array key,
it counts the number of calls together.
As an example, let's demonstrate that with some regexes:
#==>.*__construct#              Matches all constructor invocations
#==>.*TextNode::__construct#    Matches all constructor invocations of classes which end with TextNode

#.*#                            Matches all method calls
#.*==>Doctrine\\Common.*::__construct#'
                                Matches all object creations inside the Doctrine\Common package
Furthermore, the regex might contain exactly one submatch pattern. In this case, a popover is displayed with the top 10 invocations grouped by the regex. Example:
#==>(.*)::__construct#                Matches all constructor invocations, displaying a Top 10 list of constructor invocations
#==>TYPO3\\Fluid\\(.*)::__construct#  Matches constructor invocations in Fluid, displaying a Top 10 list of constructor invocations inside the fluid package
Paramters:
regex: '...' (seeregexSum)metric:time|calls|memorysubtype:sum|average
Custom types are currently not possible.
The calculation happens inside Sandstorm\Plumber\Service\CalculationService,
if you want to extend it. Make sure to submit a pull request then :-).
The PhpProfiler documentation has instructions on how to profile custom code.
Developed by Sebastian Kurfürst, Sandstorm Media GmbH. Pull requests by various authors.
All the code is licensed under the GPL license.